
View Horizontal Deviation on the Map
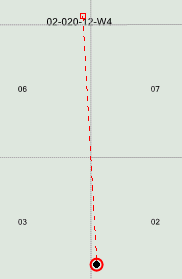
Horizontal wells are displayed on the map with a square to indicate the surface location with a line leading to the bottomhole location, which is displayed with the corresponding well symbol, as displayed below.
To display horizontal wells on the map, the wells must have Surface Latitude and Surface Longitude values. To import the Surface Latitude and Longitude values, do one of the following:
- Update Production Using an External Data Source
- Import the values using the Import Spreadsheet Data Overview tool
- Enter the values on Wells and General Economics
To display horizontal wells on the map
-
On the Map tab, click
 .
.
- Under Entity Layers, select Horizontal Deviation.